
Background
Appsketiers is a B2B Custom Mobile and Web App Development company based in Georgia, United States. Founded in 2016, they're a dynamic team who handles every stage of the process from idea to launch!
Challenges
Appsketiers faced several critical challenges that were interfering with their sales effectiveness:
- Their primary obstacle was the lack of visibility into their unique, two-phase sales process. They had an "ignition pipeline" with distinct phases but couldn't track how many prospects moved from the first phase to the second phase of the sales process. This made it impossible to create HubSpot funnel reports or identify where prospects were getting stuck in their pipeline.
- Management couldn't see sales performance reports. They needed to understand metrics by quarter and by contact owner, but HubSpot's standard reports couldn't show these specific insights due to their custom pipeline structure.
Although they're were performing well and growing, they knew they could do more using HubSpot's tools!
Solutions
OTF developed a three-part reporting solution designed to give the Client complete visibility into their ignition pipeline performance, with the flexibility to analyze data from multiple angles.
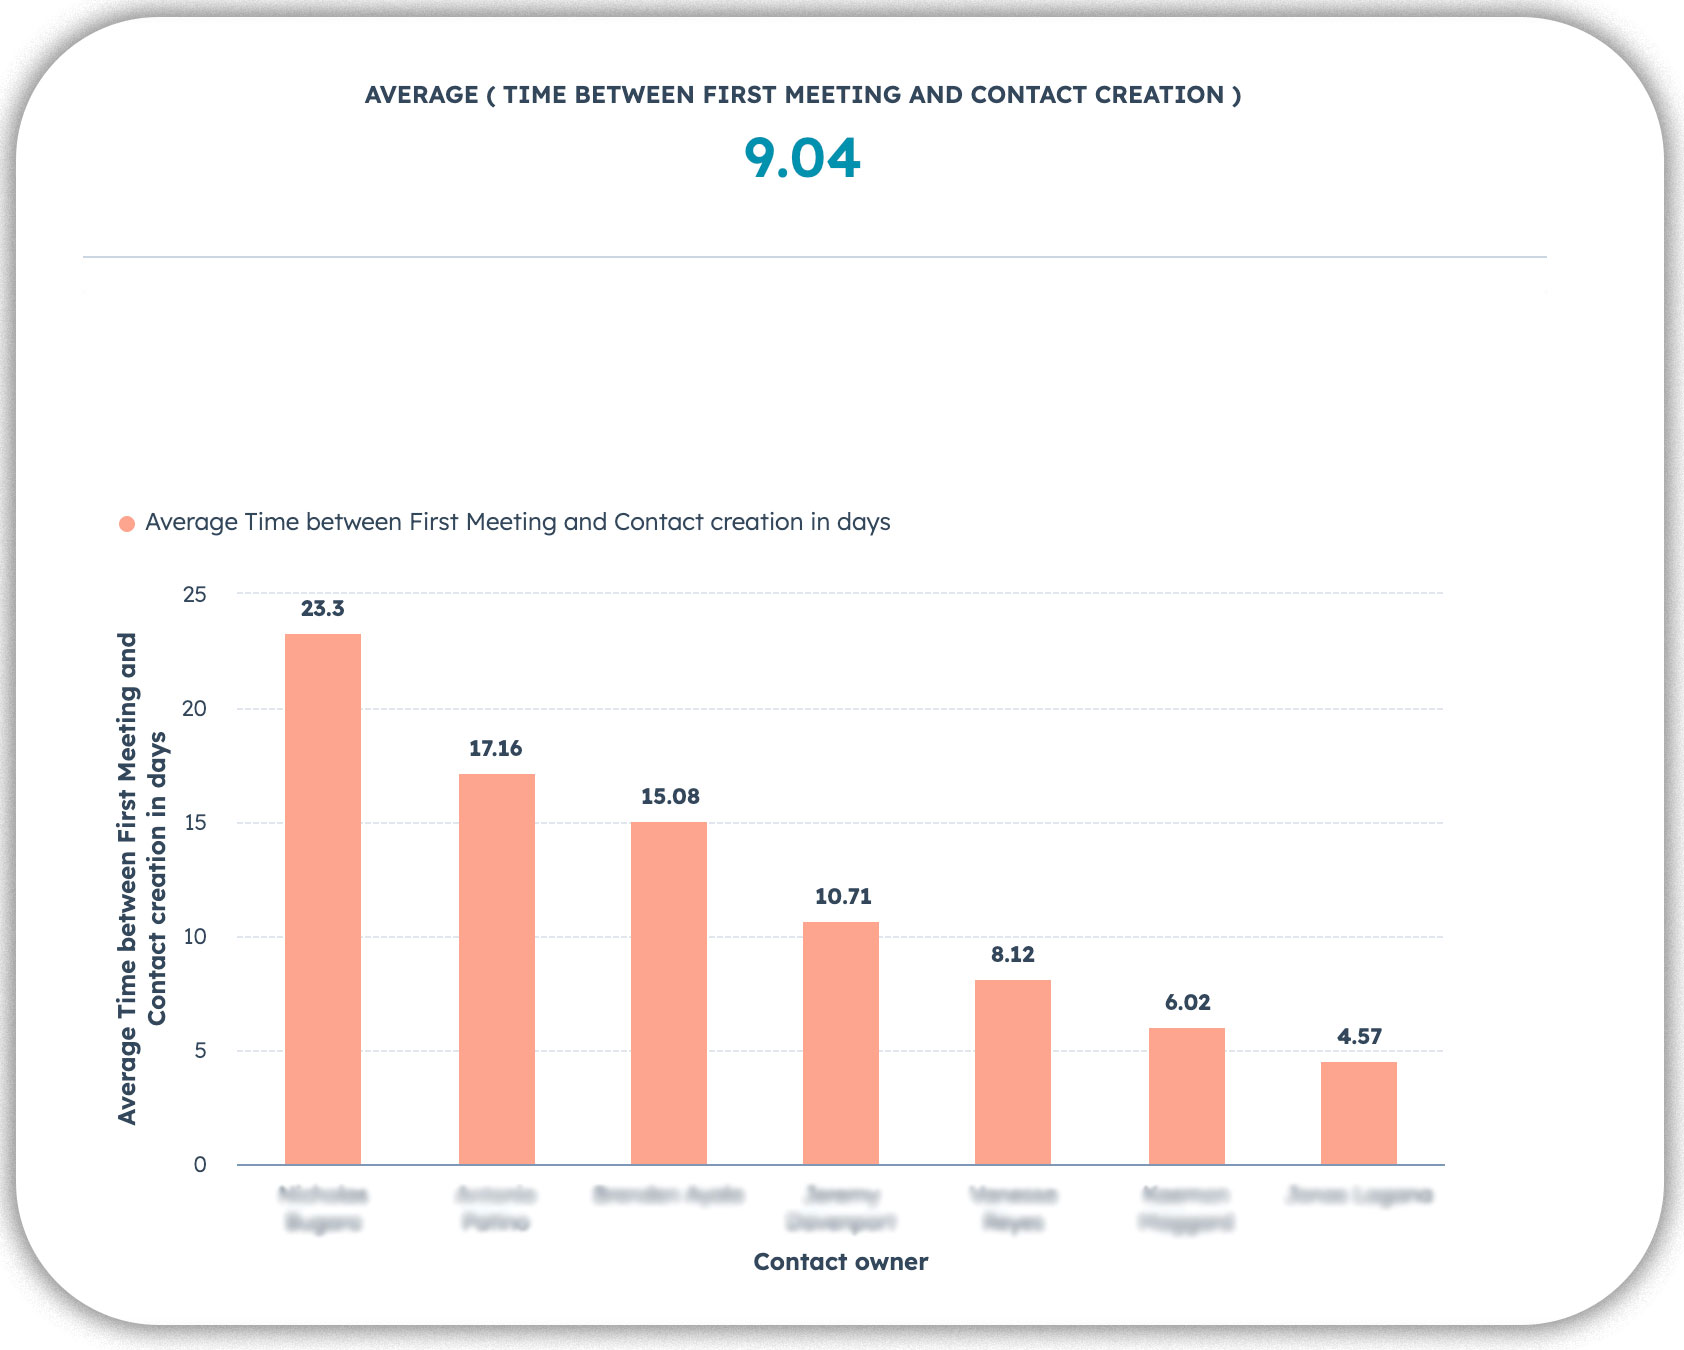
Part 1: Total Pipeline Movement Report
- Built a custom report tracking unique deals transitioning from phase 1 to phase 2.
- Highlighted specific movement into the "promise hot" stage where qualified opportunities begin.
- Created visual dashboards showing conversion percentages and deal flow.
Part 2: Time-Based Performance Analysis
- Developed quarterly reporting capabilities to track seasonal trends.
- Added monthly and weekly breakdowns for shorter-term optimization.
- Built historical comparison tools to measure improvement over time.
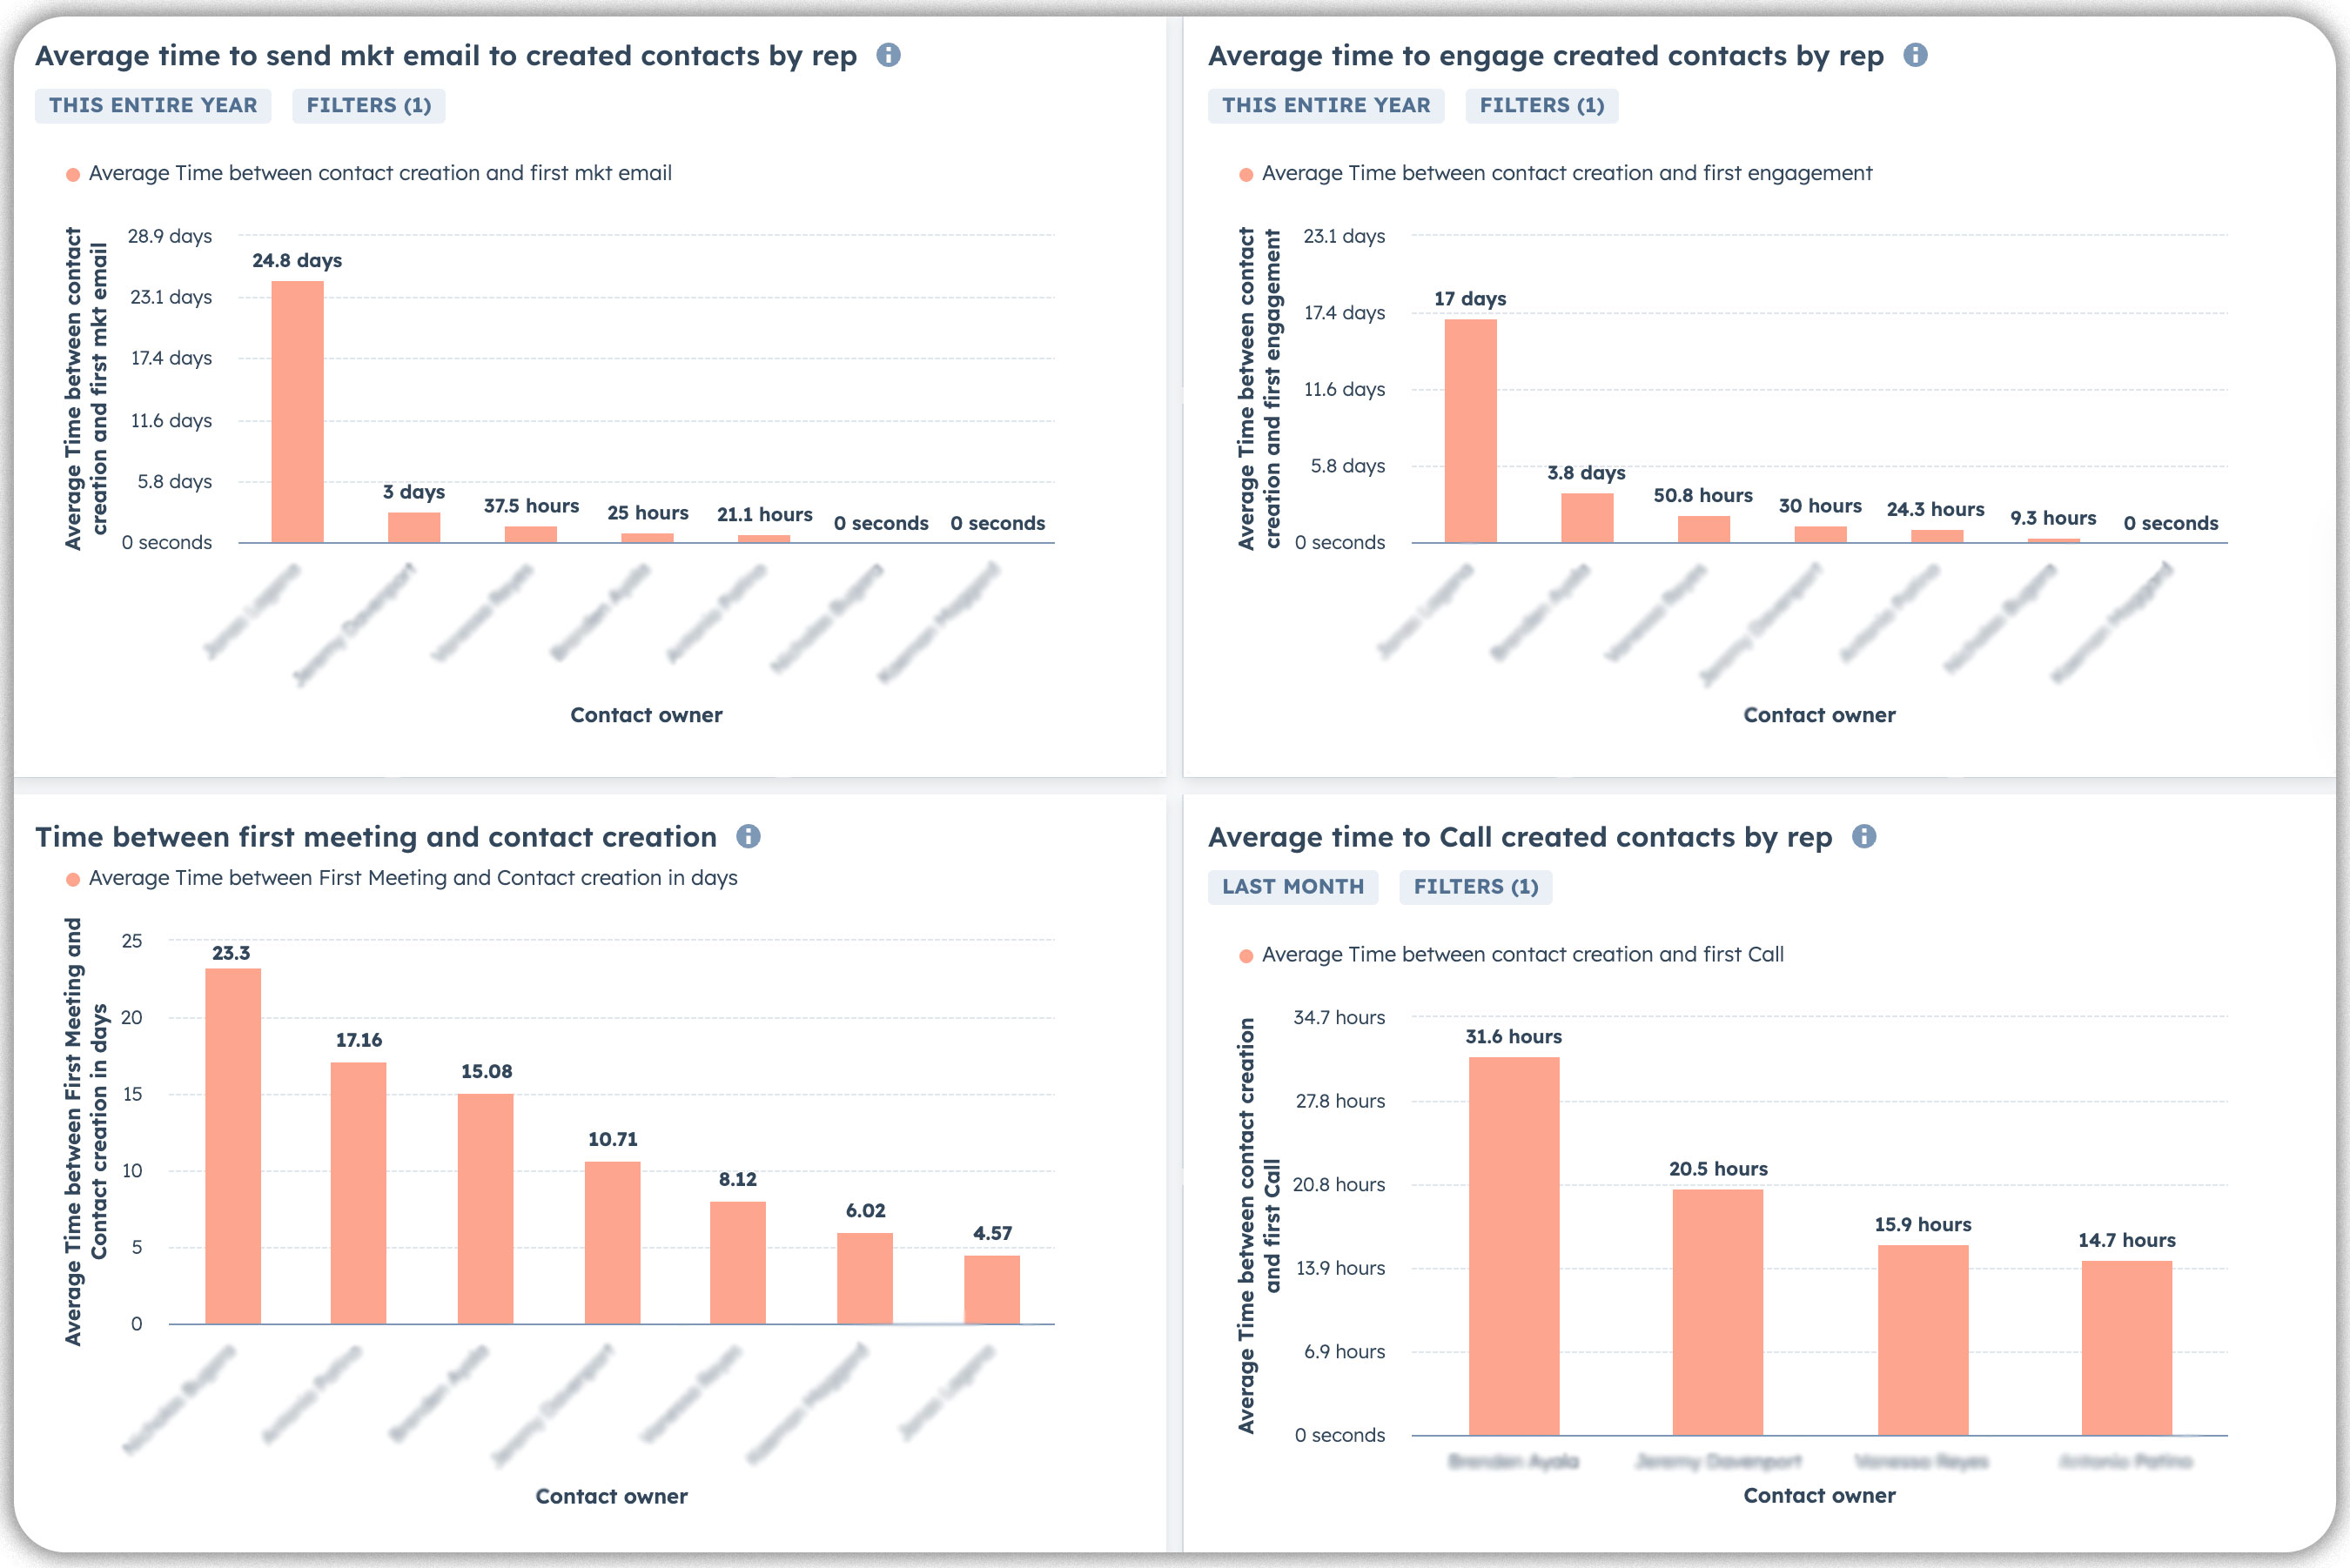
Part 3: Sales Rep Performance Tracking
- Created individual contact owner reports showing conversion rates by sales representative.
- Built leaderboards and performance benchmarks.
- Added deal velocity measurements to identify top performers.
Optimization Results
- Complete Pipeline Visibility: Gained real-time tracking of deal progression through their two-phase ignition pipeline.
- Conversion Rate Analysis: Can now measure and optimize the percentage of deals moving from phase 1 to the "promise hot" stage (first stage of the phase 2 sales funnel).
- Performance by Quarter: Historical and current quarterly performance analysis for strategic planning.
- Individual Sales Rep Tracking: Contact owner performance metrics enabling targeted coaching and optimization.
- Data-Driven Decision Making: Replaced guesswork with concrete data for sales strategy and resource allocation.
What's Next?
The Client is now positioned to implement advanced HubSpot automation and AI-powered reporting features. The next phase will focus on predictive analytics, automated reporting workflows, and integration of additional data sources to create an even more powerful business intelligence system.
Other case studies

Achieving 100% Lead Management Automation: HubSpot Lead Scoring and HubSpot Reports
Background Our client is a B2B financial services company based in the.
HubSpot Sales Pipeline Cleanup and Optimization for AZ Water Solutions
Background AZ Water Solutions is a B2C water treatment company based i.
How Signature Custom Cabinetry Built Their First Digital Marketing System and Automated Deal Tracking
Background Signature Custom Cabinetry is a B2B and B2C custom furnitur.
Carlocker's HubSpot Transformation: From Siloed Data to Streamlined CRM
Background Carlocker is a premier automotive business specializing in .

How The Hands and Feet Automated Multi-County Service Delivery with Custom HubSpot Workflows and Typeform Integration
Background The Hands and Feet is a B2C nonprofit organization located .

How Riverside Insights Eliminated 10,552 Duplicates and Built a Custom Hierarchy System in HubSpot
Background Riverside Insights is a tech-based B2B company, based in th.
How Ualett Transformed Their Cash Advance Operations With Custom HubSpot Workflows and Integrations
Background Ualett is a B2B financial services company with offices in .
How CoverForce Unified Operations with Custom JIRA Integration, Automated Workflows, and Multi-Pipeline CRM Implementation
Background CoverForce is a B2B InsurTech platform based in New York th.

How Oakgate Established Professional Brand Consistency Across HubSpot with Custom Templates and Theme Setup
Background Oakgate is a B2C rental management firm located in Californ.

Creating an Automated Underwriting Process and Eliminating Manual Work with HubSpot Automation
Background Our client is a B2B payment service provider based in the U.